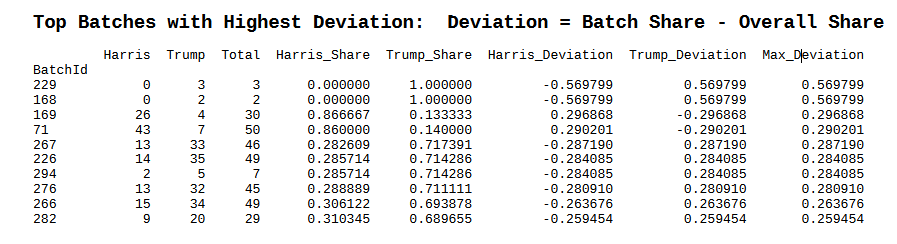
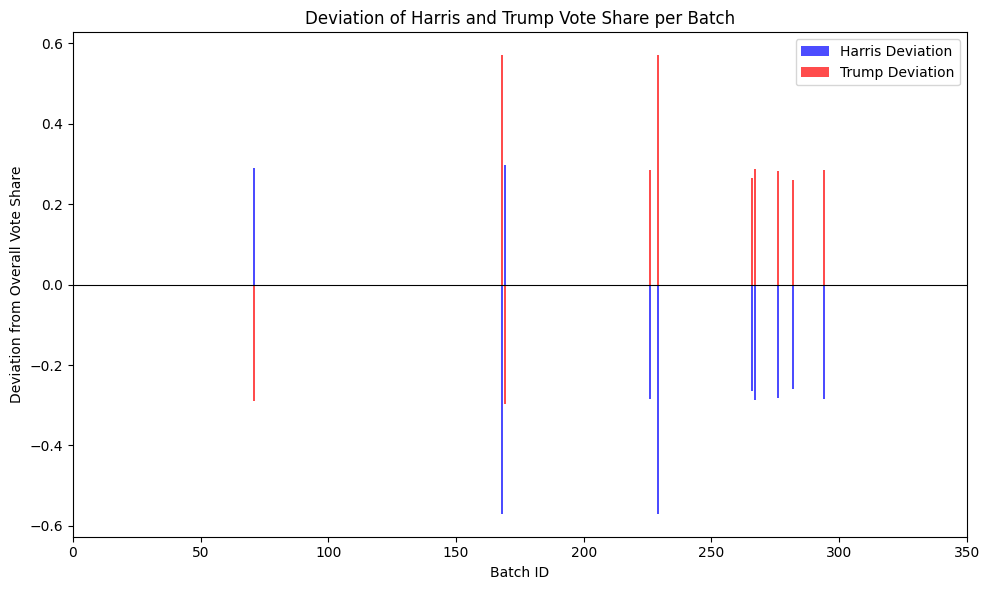
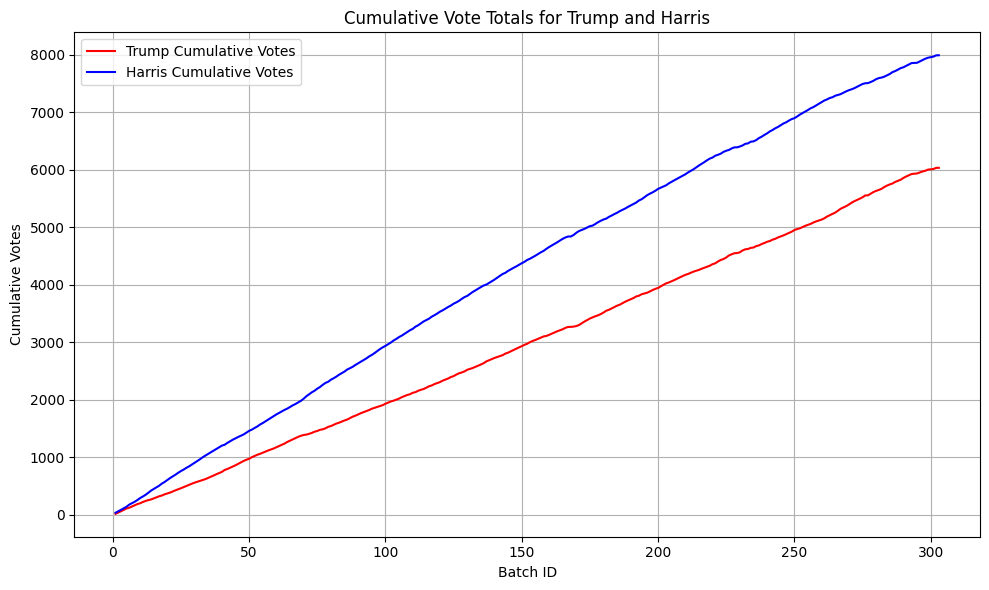
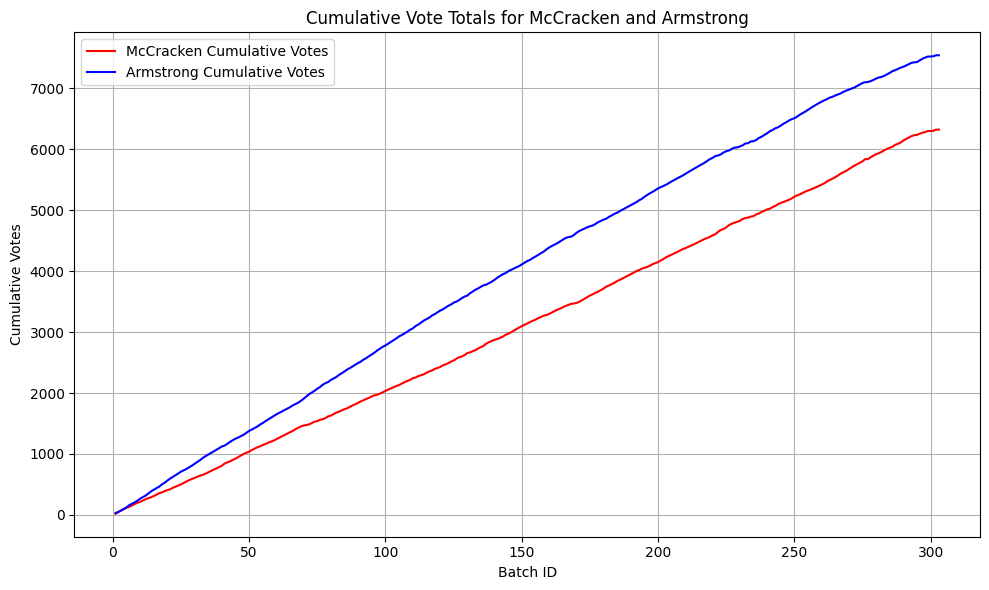
The first analysis looks for batches of votes for Trump and Harris to determine whether any batch of ballots were swapped to manipulate the results. Ballots are scanned in batches of up to 50, though some batches are much smaller. Instances where a batch of votes is heavily skewed in one direction occur only in smaller batches. Therefore, we find no evidence of ballot batches being exchanged.
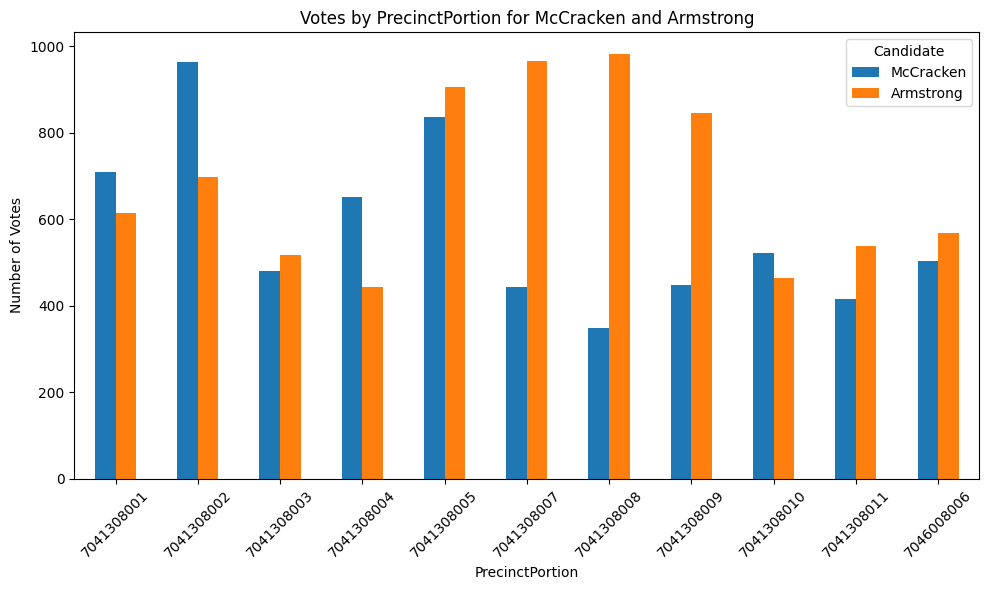
Here, we analyze one county commissioner race, examining the total votes each candidate received and the vote distribution by precinct. McCracken suffered a significant loss in Salida, precincts 007, 008, and 009.
Here’s a table to identify the precincts:
Precinct 7041308001 is Buena Vista Ward 1
Precinct 7041308002 is Buena Vista Ward 2
Precinct 7041308003 is Buena Vista Ward 3
Precinct 7041308004 is Nathrop
Precinct 7041308005 is Salida addresses outside of the City
Precinct 7046008006 is Salida addresses outside of the City
Precinct 7041308007 is Salida Ward 1
Precinct 7041308008 is Salida Ward 2
Precinct 7041308009 is Salida Ward 3
Precinct 7041308010 is Nathrop
Precinct 7041308011 is Poncha Springs
Votes for McCracken and Armstrong:
   McCracken  Armstrong
        6321       7540
Here we’re looking for the correlation between Trump and McCracken votes and Harris and Armstrong votes.
Votes for McCracken Armstrong Trump Harris:
   McCracken  Armstrong  Trump  Harris
1       6321       7540   6034    7992
Trump voters who did not vote for McCracken: 633
Harris voters who did not vote for Armstrong: 1017
Armstrong voters who voted for Trump: 363
McCracken voters who voted for Harris: 613
Chi-squared test results: 95% confidence showing that the Trump/McCracken distributions are significantly different. No correlation between Trump and McCrakcen voters.
Chi-squared statistic: 8969.812320761532
p-value: 0.0
Degrees of freedom: 1
Expected frequencies:
[[4882.03444976 3713.96555024]
 [3426.96555024 2607.03444976]]
The distributions are significantly different (reject null hypothesis).
Chi-squared test results: 95% confidence showing that the Harris/Armstrong distributions are significantly different. No correlation between Harris and Armstrong voters.
Chi-squared statistic: 9003.550892893029
p-value: 0.0
Degrees of freedom: 1
Expected frequencies:
[[3216.91182502 3421.08817498]
 [3873.08817498 4118.91182502]]
The distributions are significantly different (reject null hypothesis).
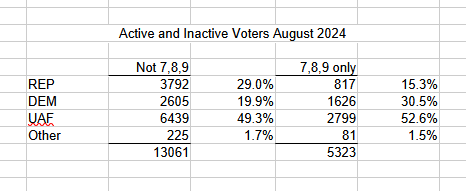
Here’s a birds eye view of the voter rolls between August and November 2024.
18,384 active and inactive voters were registered in August.
 4,647 of those registered in August did not vote in November.
   832 new voters were added to the rolls in November and voted.
14,569 did vote in November.
218 of the 832 new voters voted in person, not by mail.
I do not have addresses for 70 of the 832 new voters. Google could not find another 127 of the 832 addresses; however, Google is not very reliable.
Here’s a map of 635 of the newly registered voters: Newly Registared Voters in 2024 - Google My Maps
The new voters appear randomly scattered across the county.
Here’s an analysis (k-means cluster) that shows precincts 2 and 4 strongly Republican and 7 through 9 strongly Democratic. The other precincts are neutral.
                Trump    Harris  McCracken  Armstrong    Nyberg   Lucrezi cluster
Precinct
7041308001   0.466429  0.490000   0.506429   0.439286  0.438571  0.469286     0
7041308002   0.533065  0.418631   0.553767   0.401380  0.518689  0.391029     2
7041308003   0.413208  0.528302   0.452830   0.486792  0.393396  0.474528     0
7041308004   0.539474  0.413158   0.571930   0.388596  0.509649  0.382456     2
7041308005   0.455731  0.514938   0.454644   0.491581  0.422053  0.474742     0
7041308007   0.277851  0.687003   0.293767   0.640584  0.264589  0.644562     1
7041308008   0.239517  0.709311   0.248045   0.698650  0.209666  0.683724     1
7041308009   0.317784  0.648688   0.325802   0.615889  0.279883  0.614431     1
7041308010   0.472249  0.494645   0.508277   0.450828  0.455696  0.452775     0
7041308011   0.410382  0.539667   0.407444   0.525955  0.367287  0.526934     0
7046008006   0.417937  0.552466   0.451121   0.510314  0.388341  0.522870     0
I always thought that BV was conservative, but BV precincts 1 and 3 were neutral in their voting. Only precincts 2 and 4 voted conservatively.
Looking at the affiliations in the county, excluding Salida, the county is Republican 3 to 2. Salida is Democratic 2 to 1.
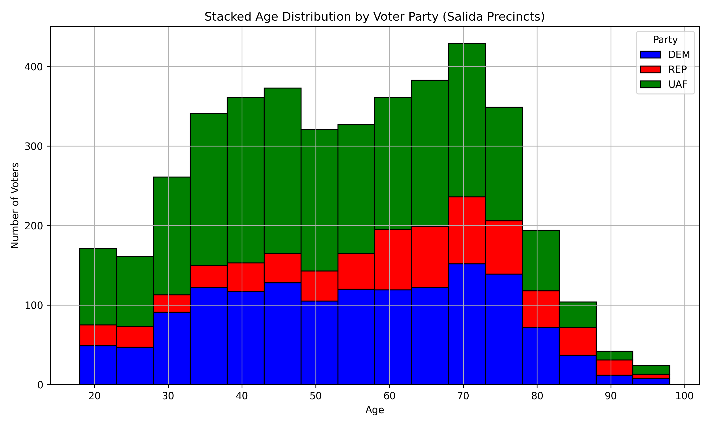
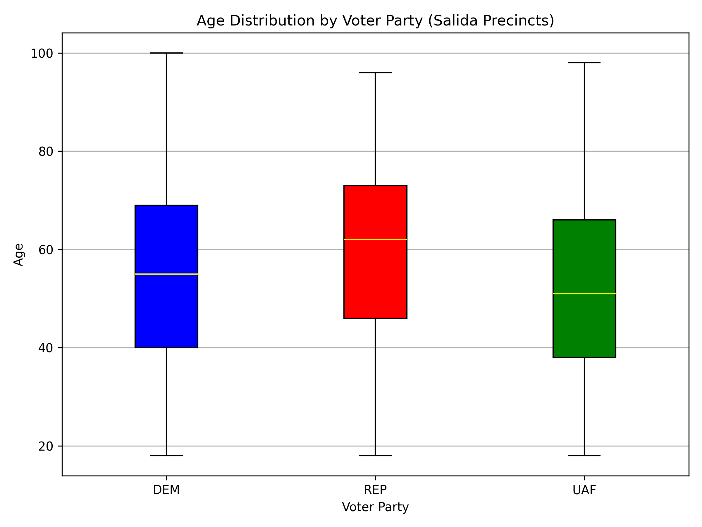
Here’s a breakdown of the ages of votes in the City of Salida from the 2024 Presidential election:
• The histogram illustrates that most Salidan voters are around 70 years old, with another noticeable peak around 45.
• The box plot shows the average age of Salidan voters by party (indicated by the yellow line). The height of the boxes represents the range from the 25th to the 75th percentiles, while the “whiskers” mark the minimum and maximum values in the dataset.
• The average age of voters by party:
◦ Democratic voters: around 55
◦ Republican voters: around 62
◦ Unaffiliated voters: around 50
This data points to an aging voter base, slightly more so among Republicans, which could have implications for future elections.
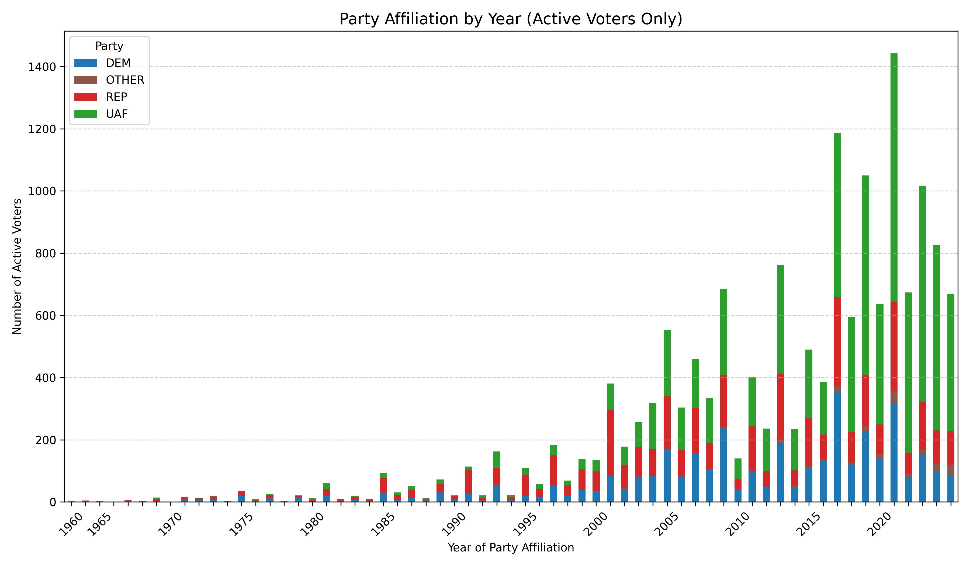
Here’s an illustration of the shifts in voter party affiliation over time for all Chaffee County voters, with a particular focus on age and party registration trends. Here’s a breakdown of the three charts:
Party Affiliation by Year (Stacked Bar Chart)
This chart shows the number of active voters, broken down by party affiliation, for each year of voter registration. The stacked bars represent Democratic (DEM), Republican (REP), Unaffiliated (UAF), and Other parties.
-
Key Insight: This chart reveals how the composition of party affiliation has shifted over time. It highlights that Unaffiliated voters have been growing significantly in recent years, while Democratic and Republican voters have experienced a slight decrease in share.
-
Note: The numbers here represent either the affiliation of newly registered voters or a change in affiliation by existing voters. This can reflect shifts in voter sentiment or behaviors over time.
Party Affiliation by Year (Percentage Line Chart)
This line chart takes the data from the previous chart but shows the percentage of total voters registering in each party category by year.
-
Key Insight: The trend here is more evident in terms of relative proportions. We can clearly see that Unaffiliated voters are steadily increasing as a percentage of the electorate, while Democrats and Republicans are each losing ground. The chart is useful for understanding the broader political shift within the electorate over time.
-
Note: As with the first chart, these percentages reflect either new voter registrations or affiliation changes, giving us insight into how both new voters and existing ones are shifting their party alignments.

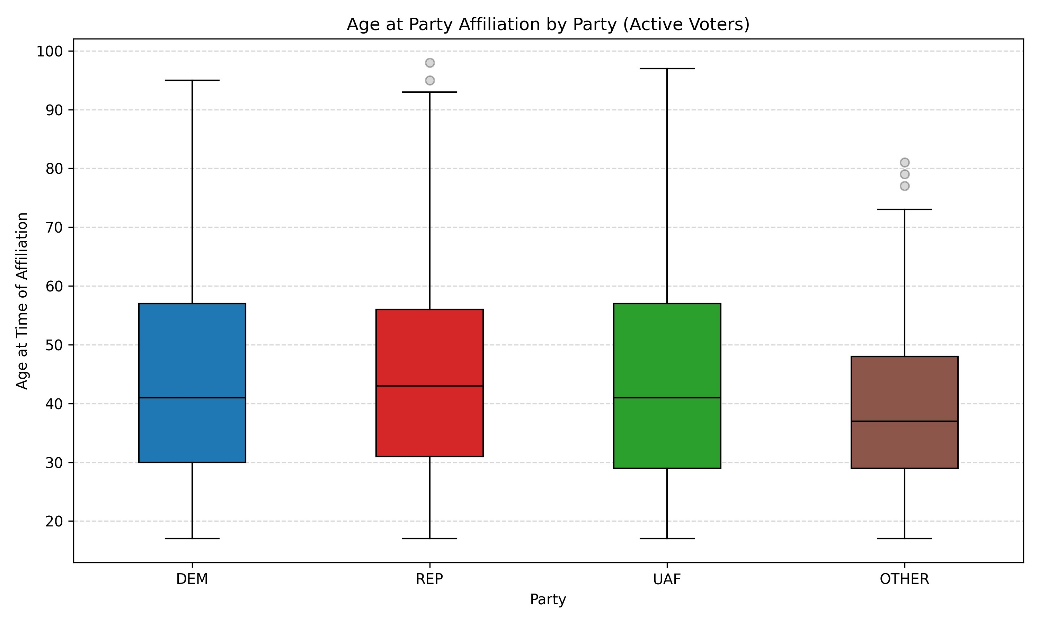
Age at Party Affiliation by Party (Colored Box Plot)
This box plot shows the age at which voters affiliated with a party, broken down by Democratic (DEM), Republican (REP), Unaffiliated (UAF), and Other groups. Each box represents the middle 50% of the age data, with the whiskers showing the range, and the median age marked by an orange line.
- Key Insight: The plot suggests that there is no significant difference in the age at which voters affiliate with major parties (DEM, REP, UAF). The median age for Other voters is slightly younger, indicating that younger voters are more likely to be Other parties compared to those who affiliate with a major party. However, the differences between the parties are relatively minimal when it comes to age at affiliation.