DataJeff, Analytics Lead for US Election Integrity Project, says:
We saw this pattern in the Colorado Data. Every county I have looked at so far has the same build-up towards an election and then a culling immediately after an election. We found this pattern last year. Blue line is the voter roll growth (From the SoS website) since 2016 and red line is the voting population growth (from the CO demography office) since 2016
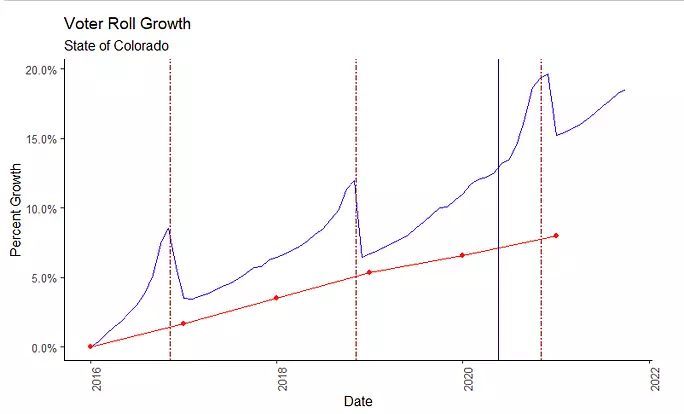
The y axis is the percentage growth since 2016 for total voters (active, inactive, and pre-registered) from the SoS voter rolls and the percentage growth in voting population (those who were 17 at the time of the election for each year).
Voter rolls accessed from the Colorado Secretary of State’s website: example: https://www.sos.state.co.us/pubs/elections/VoterRegNumbers/",years[i],"/January/statistics.xls where years[i] was the year that the voter roll corresponded to (e.g., 2017).
County level population retrieved from https://demography.dola.colorado.gov/population/data/county-data-lookup/